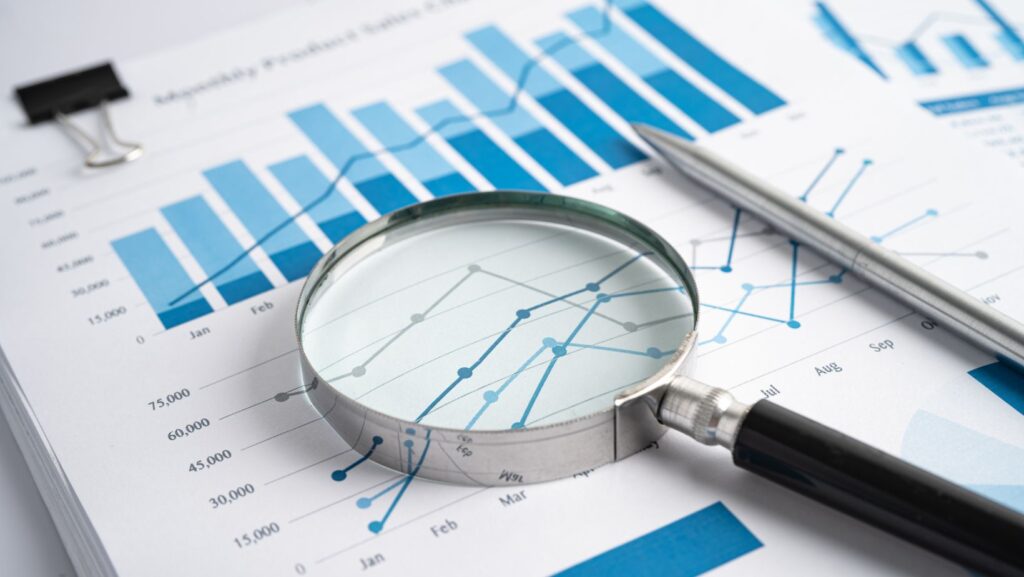
Are you looking to turn your data into eye-candy? Knowing the right chart type can take your visuals from blah to brilliant!
Whether you’re showing trends, comparisons, or parts of a whole, each chart has its superpower. From pie charts to heat maps, using the right one makes your story pop.
This guide will walk you through the must-know chart types and when to use them-so you can visualize like a pro and impress your team, audience, or just yourself. Let’s make those numbers shine together!
Bar Chart
Bar charts are perfect for comparing different groups or categories side by side. Each bar represents a value, making it easy to see which items are higher or lower.
This chart makes it simple to spot trends, whether you’re tracking sales by product or survey results. It can also be vertical or horizontal and work great with small and large data sets.
Their straightforward layout makes them a favorite for quick analysis. They’re ideal for presentations since the visual contrast helps data stand out clearly.
Line Chart
Line charts are excellent for showing trends over time. They connect data points with a continuous line, making it easy to see increases, drops, or steady patterns.
You can even use them to:
- track monthly sales
- website traffic
- temperature changes
The smooth flow of the lines helps your audience follow the story your data is telling. Line charts work well with large data sets and can include multiple lines for comparison.
They’re a smart choice when you want to highlight movement, changes, or progress. Simple and effective, they’re a classic for good reason.
Pie Chart
Pie charts are all about showing parts of a whole. Each slice represents a percentage, making it easy to see how different segments compare.
They’re ideal for simple data sets like budget breakdowns or customer demographics. Plus, they’re great when you want to emphasize proportion or contribution. Just remember, too many slices can get confusing.
For a quick and clean visual, keep it simple. So if you want to create one easily, you can get a jump start using a pie chart generator. It’s a fun and easy way to turn data into a visual treat.
Scatter Plot
Scatter plots are used to show relationships between two different variables. Each point on the chart represents a data pair, making it easy to see patterns, trends, or even outliers.
They’re best for finding correlations, like the link between marketing spend and sales. When the dots form a line, there’s often a strong relationship. They are useful in:
- science
- economics
- business analytics
You can even add a trendline for more insight. They’re simple to create but powerful in what they reveal. Use them when you want to explore how one variable affects another.
Area Chart
Area charts are like line charts, but with the space under the line filled in. This creates a strong visual impact and helps emphasize the volume behind the trend.
They’re perfect for showing cumulative data over time, such as revenue growth or user adoption. Area charts help highlight individual values and the overall pattern. You can use stacked versions to compare multiple data sets easily.
They work well when you want to display totals and trends together. Clean and colorful, area charts make it easy to spot big movements in your data.
Histogram
Histograms are ideal for showing the distribution of data. They group values into ranges, which makes it easier to see how often certain numbers appear. This is helpful when analyzing things like:
- test scores
- age ranges
- product sizes
Unlike bar charts, histograms have no gaps between bars because the data is continuous. They reveal patterns such as skewed distributions or data clusters.
If you want to check for normal distribution or identify outliers, histograms are the way to go. They’re perfect for giving your audience a quick view of how your data spreads out.
Bubble Chart
Bubble charts take scatter plots to the next level by adding a third dimension-size. Each bubble represents a data point, and its size shows an extra variable. This makes it easier to show more complex relationships in a single chart.
They’re great for:
- displaying market trends
- project comparisons
- business growth
Just be sure to label the bubbles clearly so viewers understand what they’re seeing. When used well, they deliver depth and clarity. They’re ideal when you want to highlight impact and relationships at once.
Heat Map
Heat maps use color to show data density, frequency, or intensity across a table or grid. The warmer the color, the higher the value.
These charts are great for spotting patterns quickly, especially in large data sets. You might use one to visualize:
- website clicks
- sales across regions
- performance metrics
Also, heat maps are very intuitive and visually striking. They help people understand complex data at a glance. They’re useful in dashboards and reports where quick decisions matter.
If you want to turn raw numbers into immediate insights, heat maps do the trick.
Radar Chart
Radar charts, also known as spider charts, show multiple variables on a circular grid. They’re useful for comparing different items across the same set of features.
Each axis represents a category, and lines connect the values to form a shape. You might even use a radar chart to compare:
- product features
- team skills
- performance metrics
They’re great for showing strengths and weaknesses at a glance. Though not ideal for large data sets, they shine in comparison tasks. Their unique layout also grabs attention, making them a standout visual tool in reports and presentations.
Tips for Choosing the Right Chart Type
Picking the right chart type makes your data clearer and more meaningful. It helps you tell the right story and keeps your audience engaged. Whether you’re comparing values, showing trends, or exploring relationships, there’s a perfect chart for the job.
Ready to turn your numbers into visuals that stand out? Start exploring chart types today and bring your data to life with confidence!
Did you find this article helpful? Check out the rest of our blog now!


